At the end of the day
Reports are easy. Knowing what to do is not.
Every till gives you a sales total. This page opens on what has started selling and what has gone quiet, tells you what a dish leaves after it costs you something, and closes on a list of what to buy before it runs out.
Demo data
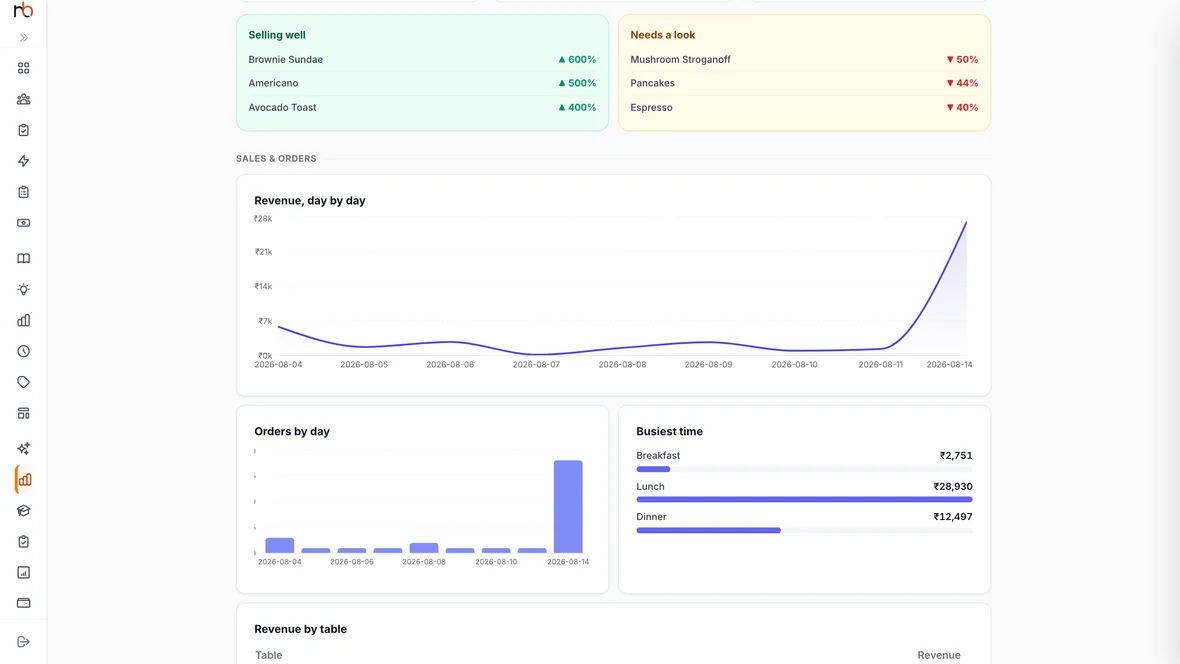
Opens on what is selling and what is not
The questions it answers without being asked
What moved, and which way
Selling well and needs a look, side by side, against the same period last time — so a dish that quietly halved is not something you notice in three months.
When the room actually fills
Breakfast, lunch and dinner as revenue, and the day hour by hour. Rostering is a different conversation once you can see it.
Revenue is not profit
Once a dish has a recipe, it carries what it cost to make. The bestseller and the money-maker are frequently not the same dish.
Whether the upsell landed
How many suggestions were shown, how many were taken, and what the bill did when one was. A number you can act on rather than a feeling about the staff.
New against returning
How many came back, and how often. A busy month of first-timers and a busy month of regulars are different businesses.
It ends on a list, not a chart
What runs out first, roughly how many days you have, and what to order. That is the part of a report anybody uses.
How to read it in two minutes
- 01Pick the periodToday, yesterday, this week, this month, or any two dates. Everything below re-reads at once.
- 02Start at the moversSelling well on the left, needs a look on the right. If nothing surprises you, you are done.
- 03Check what it earned, not what it soldMoney-makers first, then the full dish table with cost and margin against every line.
- 04Leave with the reorder listThe last card is what to buy. Take it to the supplier or raise the purchase order from it.
Things people ask it for
- Export to PDF
- The whole period as a document — for a partner, an accountant, or a landlord who wants numbers.
- Revenue by table
- Which spots earn and which are decoration. Awkward reading for most floor plans.
- Every dish, labelled
- Star, rising, quick win, high value — the whole menu ranked rather than a top five.
- Channel by channel
- Dine-in, counter, delivery and room service kept apart, because they do not cost the same to serve.
Questions people actually ask
How is this different from the sales report our current billing software prints?
A sales report tells you what came in. This tells you what it cost to earn, which dishes moved against last week, whether the suggested add-on was taken, and what to order tomorrow. The total is the least useful number on the page.
Do we need inventory set up for the profit numbers to work?
For cost and margin, yes — a dish knows what it costs because a recipe says what it is made of. Everything else on the page works from the orders alone, so it is useful from day one and gets sharper as you fill recipes in.
Can our manager see this without seeing everything else?
Yes. Roles decide which screens a person opens, so a manager can be given the numbers without the settings, the staff records or the bank details.
Is it live, or yesterday’s data?
Live. Pick “today” and it is counting the orders you are taking right now.
See a month of your own numbers.
Fifteen minutes. Bring last month’s sales and we will show you the same page reading your menu.